Predicting First-Year Retention?
Can a belonging survey & a neural network predict first-year student retention?
Executive Summary
The Charge
Build a neural network that can predict whether First-Year college students will return to campus for the following Fall semester, using data from class surveys including a series of multi-dimensional questions relating to their sense of belonging.
Insights:
- Predicting student behavior is extremely difficult; proceed with caution.
- A neural network outperformed both logistic regression and probablility-based methods.
- Improving the quality of the data is hugely influential.
- The complexity of the belonging-oriented data makes the model prone to overfitting; knowing when to quit tuning is key.
Recommendations:
- Feeding the most predictive data features into the neural network is extremely important, and significantly helps to prevent overfitting. The data can, and should come from a variety of areas including demographics, financial, attitudinal survey data like the one featured here, as well as academic performance data.
- Building the survey with the analysis in mind is a best practice; keep iterating the survey.
- One of the keys to solving the overfitting is to make compromises in terms of accuracy in the training phase.
- This is just a tool to guide interventions, therefore institutions need to assess the limits of their resources, and then adjust the decision threshold for the model in order to generate a list of the students most likely to depart that aligns with the number of students that the school is resourced to support appropriately.
- With better data, it might be possible to use the model to not only predict if a student is a retention risk, but also what their specific risk profile looks like. This may further help the university to target its intervention approach.
Context
Colleges and universities recognize the critical importance of first-to-second year student retention for sustaining consistent revenue streams. Improvements in retention are possible when institutions proactively engage with students during their time on campus. However, such interventions come at a real-world cost, emphasizing the need for efficient allocation of resources. To achieve this, accurate prediction of which students are most likely to leave carries enormous value.
The traditional probability-based models, focusing primarily on demographic features, that institutions typically rely on are less predictive than they might seem. In this study the probability model’s accuracy was only 61.4%.
A neural network model that included complex survey data relating to a student’s sense of belonging as well as demographica features performed significantly better, exhibiting a predictive power nearly 10% better than demographic-based probability.
One critical factor in this success lies in the quality of the data utilized; focusing on the most predictive input features yielded significantly improved results with accuracy levels of nearly 70%. Further enhancements to the model are likely possible, but they largely depend on acquiring additional data features relating to known retention factors such as financial aid status and mid-term academic performance.
Fortunately, ongoing data collection efforts offer the opportunity to validate our initial findings. Should these results hold up, we can then compile a list of at-risk students while they are still on campus, presenting prime targets for timely and effective interventions. It may also be useful to build individual profiles for the students predicted to depart from the university. Such profiles may help university staff to tailor thier intervention efforts to suit each individual student.
In summary, our machine-learning approach to predicting student retention not only outperforms traditional methods, but also holds the potential for transformative impact. We can bolster student success, bolster institutional stability, and secure a brighter future for both students and the institution.
Before We Build the Model
Cleaning the Data
There were two distinct phases to this work: data repair and dealing with null values. Both of these issues point toward issues with the survey itself.
Data repair consisted of using other datasets to determine the identity of students who entered bad ID numbers. The students’ names & email addresses were used to locate the correct ID numbers in other databases. These ID numbers were critical because they are used to determine whether or not a student was retained for the following Fall semester. Some of this work was not easily automated and had to be done by hand.
Much of the remaining cleaning came down to dealing with null values. Since the survey did not require students to complete all of the questions (a clear flaw in the survey), there were numerous rows where values were simply missing. Since the dataset encompassed more than 80% of the students in the group to be studied, the fact that we lost 7% of the data through this first round of cleaning still leaves us with a highly-representative sample size.
All data was converted to numeric values since that is what the Neural Network requires.
Predictive Modeling with Probability Alone
There is a clear difference between identifying the relative probability rates of student retention for different groups and predicting which individual students will depart. And that difference is fairly simple to calculate.
If we only look at the question that asks if the student is the first generation in their family to attend college we learn that 18% of the students are indeed “First Gen” college students, and we also learn that they are 7% less likely to be retained at the university a year later:
First Year Retention for First-Gen Students:
- First-Gen: 72%
- Not First-Gen: 79%
That seems like a fairly significant difference, but it does not ultimately lead to a highly actionable prediction.
When we take this 72% retention rate and use it to try to predict which of the First-Gen students in the test-batch would actually come back the next year the results were unimpressive:
| First Gen: 104 | Pred. Stay | Pred. Leave |
|---|---|---|
| Actual Stay | 53 | 26 |
| Actual Leave | 14 | 11 |
The model accurately predicted the retention status in 64 out of the 104 cases; the overall accuracy of the prediction is only 61.5%! Of the 25 first-gen students in this population who actually left, this algorithm only predicted 11 of them.
Since the random splitting of the samples introduces some noise into the predictions, it is helpful to run this algorithm say 100 times, with a different randomly-split population each time, and then average the predictive accuracy results:
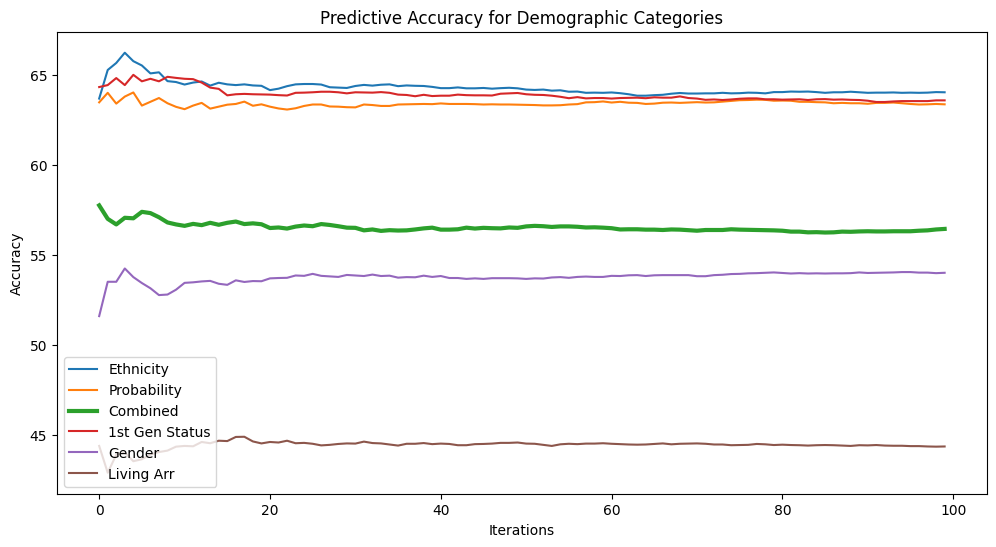
This chart shows that some of the demographic questions were significantly less predictive; a student’s gender, or whether or not they lived on campus offered essentially no predictive power. Knowing which features in the dataset were most predictive is key to improving the performance of the model later on, but none of these features resulted in accuracy ratings as high as what could be achieved through other methods.
Experimenting with Logistic Regression
Since we are looking to determine the answer to a binary question: Will they stay, or will they go, we are clearly in the terrain of logistic regression. This is an approach that is specifically attuned to taking multiple signals and creating predictions base on the combination of the signals.
SciKitLearn has a well-developed algorithm for performing logistic regression analysis. And with a decision-threshold set at 0.5, the results look like this:
| Log.Regression | Pred. Stay | Pred. Leave |
|---|---|---|
| Actual Stay | 352 | 5 |
| Actual Leave | 112 | 2 |
At this point the algorithm is little different from just guessing “stay” every time. If we experiment with different decision-thresholds we can see something interesting happen:
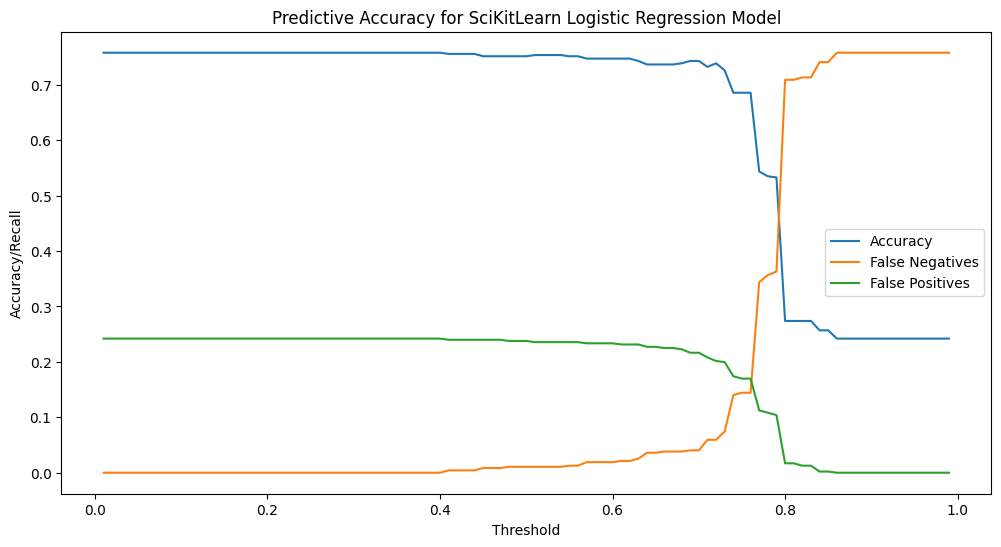
On the left side we are seeing an approach that equates to “Guess stay every time,” and on the right you see “Guess leave every time, neither of which results in an actionable prediction. The zone in between is where things get interesting. If you “tune” this algorithm you can get to a point where you are catching more of the “leaves than you are missing.
| Threshold: 0.79 | Pred. Stay | Pred. Leave |
|---|---|---|
| Actual Stay | 186 | 171 |
| Actual Leave | 49 | 65 |
With the decision threshold at 0.79 we are catching more “leaves” than we are missing, but in doing so we are predicting that nearly half of our students will leave, and so nearly 3/4 of the students we will be reaching out to will be wasted interventions! The overall accuracy of this model is only 53%!
Time for a Neural Network!
Thus far we have not really engaged with the data from the survey that attempts to get at the students’ sense of belonging, and a neural network is a highly appropriate tool for running binary classification on that kind of data. The data is subjective, but that does not mean that we cannot attempt to pull objecive trends out of that data; Netflix does this all the time!
The first model was set up as follows:
- 58 input features
- 64 nodes in the first Dense layer
- 8 nodes in the second Dense layer
- A final layer with one node
The results were predictably useless:
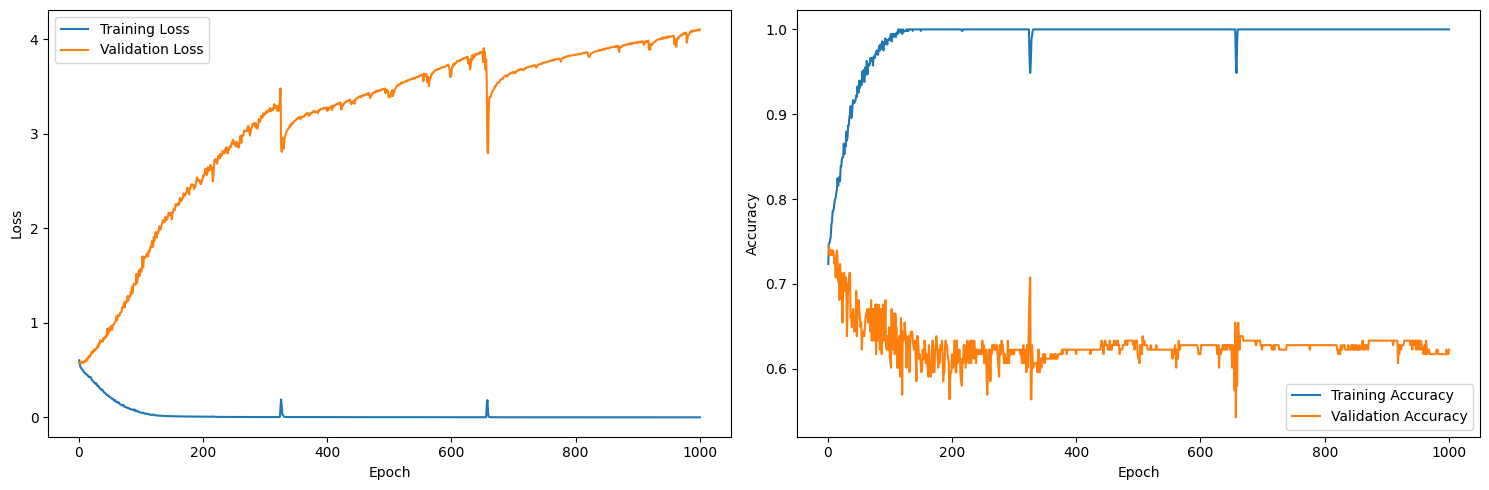
The loss figure for the training set descends nicely and the accuracy rating for the training set hits a perfect 100% after around 200 epochs. But the loss for the validation set goes through the roof, and the validation accuracy stagnates, which is a clear indication that the model is overfitting.
Model Tuning and Feature Selection
Neural_Net_Improved-Best_Data.ipynb
After a great deal of experimentation, the following changes were made:
- Rather than using all 58 input features, the top 15 “most predictive” features were identified and only those features were fed into the model
- The number of nodes in the first layer was reduced to 8
- L2 & Dropout regularization was applied to the first two layers to control overfitting
- The number of training epochs was reduced from 1000 to 100, which was the point where the validation loss seemed to hit its lowest point.
These changes made a clear difference:
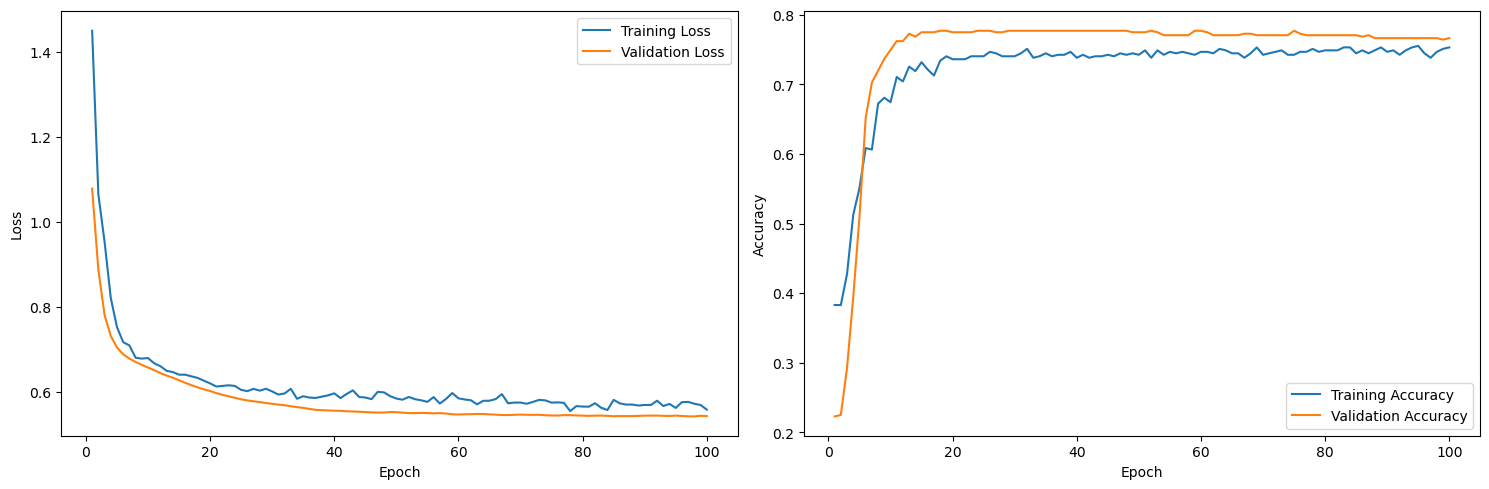
The loss rating for the validation set now descends roughly inline with the loss for the training set, and the accuracy ratings are similarly inline.
We can also tune the decision threshold for the final sigmoid classification, but this requires something of a judgment-call:
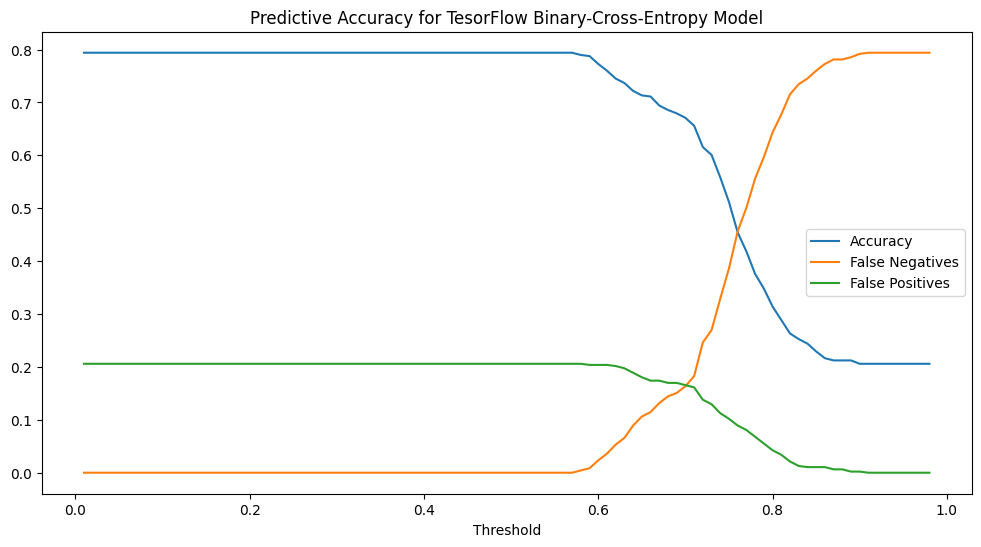
If we want to make sure we catch all of the students who will be departing, we can set the threshold quite high, but we will be swamped with false-negative predictions. A decision threshold of 0.5 or lower has the opposite problem.
It is interesting to note that the dynamics in this chart are similar to those exhibited by the probability model (Fig 2), but the curves here are much more gradual. This allows for more opportunities for intelligent tuning.
With the threshold set at 0.71, the number of false-positives & false-negatives balances out:
| Threshold: 0.71 | Pred. Stay | Pred. Leave |
|---|---|---|
| Actual Stay | 294 | 70 |
| Actual Leave | 72 | 35 |
At this point, the model’s predictive accuracy is right at about 70%, which is a good bit better than just raw probability alone (61.4%).
Knowing When to Quit
Andrew Ng (aka: The Godfather of Machine Learning) has frequently pointed out that when it comes to machine learning, tuning will only get you so far, and your time might be better spend sourcing higher-quality data rather than experimenting endlessly with tuning parameters. In this case, the best results came when we selected for the most predictive features and then were humble in the way we tuned the model